Texas Housing Insight – September 2022 Summary
The housing market continues to cool as increasing mortgage interest rates quickly diminish housing affordability. In September, home sales fell more than 15 percent over the year. Under the aggressive monetary policies, housing demand will not recover any time before the central banks see significant progress on inflation. Home prices had been depreciating, and Austin—the metro that inflated the most during 2021—saw the largest depreciation during the market’s abrupt slowdown.
Supply*
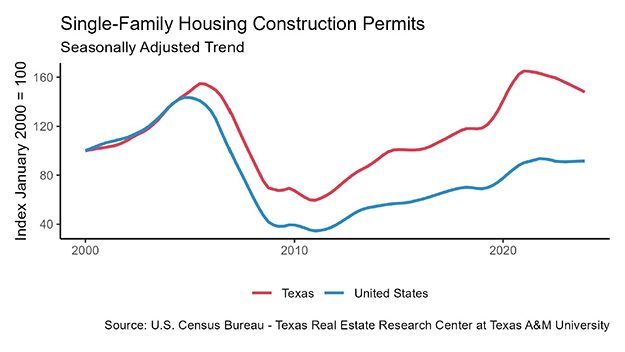
Amid slowing housing activity, Texas’ single-family construction permits dropped to a two-year low, although Texas remained the state with most issuance with 10,934 permits. Permits for building construction and renovation fell in all four major metros. For the second time this year, Dallas (3,252) surpassed Houston (3,147) in number of permits, signaling higher demand for housing in the DFW area. Austin (1,424) had twice as many permits as San Antonio (637). Contrary to the single-family sector, permits for Texas’ multifamily sector inched up marginally as builders shifted to the rental market.
The lumber producer price index (PPI) fell three times in the past four months, and the year-over-year price elevation decelerated from 74.3 percent in January to 17.6 percent in September. Despite the normalized lumber price, starts for housing projects diminished almost by one fifth quarter-over-quarter (QOQ) amid fears of a recession. At a rate of 738,000 units, the South’s total housing starts—a measure of new-home construction—weakened to a 2018. New single-family construction saw an 18.2 percent QOQ cutback in September, and single-family private construction values balanced at a two-year low. All major metros reported double-digit negative year-to-date (YTD) growths.
Zonda data corroborated the story of slowed housing supplies. Dallas saw the most drastic cut on quarterly new home starts, as the rate plummeted more than 30 percent in 3Q2022. Amid shrinking building starts, vacant developed lot inventories expanded in all metros and across all price cohorts except for homes priced less than $200K.
While homebuilding projects are expected to slow down, the state’s supply of existing homes has been accumulating. Active listings grew approximately 30 percent QOQ to a seasonally adjusted rate of 85,600 units. The state’s housing inventory recovered to the level it was at when the housing frenzy first began. This great rebound suggests a calming housing market, considering the conspicuously low inventories of the past two years. Texas’ months of inventory (MOI) ticked up to 2.6 months. San Antonio led the pack with 2.9 months, followed closely by Austin. Dallas remained the tightest with 2.2 months. The Texas Real Estate Research Center (TRERC) consider six to 6.5 months of inventory a balanced market.
Demand
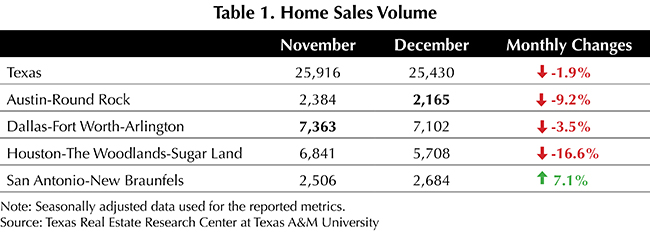
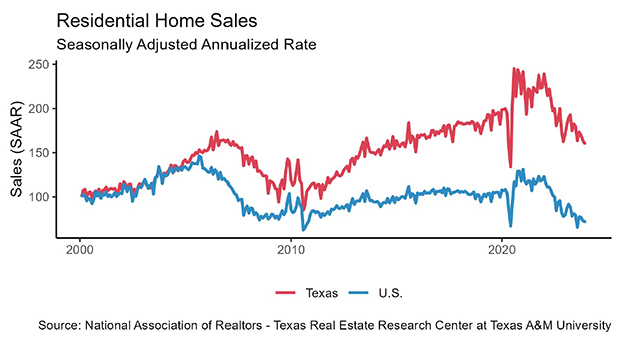
Total home sales improved 10.9 percent since July’s steep decline, reaching a seasonally adjusted rate of 31,000 closed listings (Table 1). The rapid decline in housing sales has revealed how important low mortgage rates are to the latest housing frenzy. According to TRERC’s Data Relevance Program, September sales were down 15.5 percent from a year earlier. At the current rate, year-end 2022 sales will likely fall short of 2021.
Texas’ four Metropolitan Statistical Areas (MSA) all mirrored the statewide trend, as sales in each metro shrunk by double digits YOY. Existing-home sales in these metros, which make up four-fifths of Texas’ total housing market, inched down for the eighth straight month, while new-construction sales increased marginally. This sales disparity was especially pronounced in Austin.
When differentiated by price cohorts, rising mortgage rates most adversely affected the higher-end home market. Sales shrank more than 20 percent QOQ for homes worth $750k or more, while sales decreased 7.5 percent QOQ for homes priced below $300K.
Homes are sitting on the market longer as a result of slowing sales. Texas’ average days on market (DOM) inched up to 42 days, continuously climbing from 29 days in March. DOM was shortest in Dallas at 35 days and longest in San Antonio at 47 days. Despite the prolonged waiting time, compared with the five-year average of 59 days between 2014 and the early 2020s, the relatively short period strikes a persistent imbalance between sellers and buyers’ bargaining power.
In September 2022, Texas’ DOM ranged from 38 days to 45 days, respectively, for homes in the median price cohort and in the higher-end tail. In February 2020, it ranged from 55 days to 83 days. The truncated DOM interval both in terms of value and difference of the two price cohorts implies the housing market still has ample room to fully cool down.
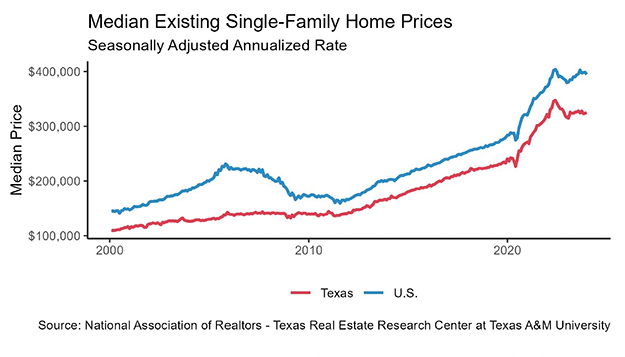
Prices
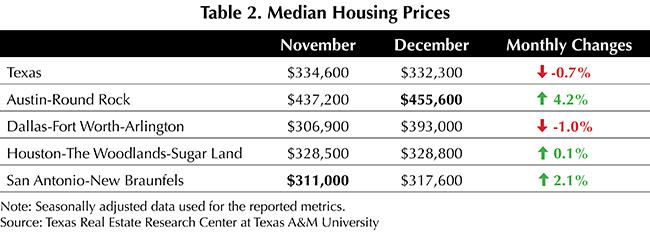
To maintain housing affordability, Texas’ home prices must fall to offset the doubled mortgage rates. The three-month-long depreciation of Texas’ median home price paused in September as major metros posted mixed responses. The state’s seasonally adjusted median price edged up to $346,000, increasing 1.2 percent MOM, while Austin’s housing prices were still falling (Table 2). As for Texas’ two largest MSAs, Dallas and Houston reported modest monthly increases of $4,000 and $8,000, respectively. Although housing prices have been under market correction, they remain much elevated from year-ago prices, accelerating 11.3 percent YOY. Even for Austin, the price in this much-affected market was still up 5.6 percent YOY.
The Federal Reserve is expected to impose more forceful monetary policies in the upcoming year to combat inflation. In accordance, the ten-year U.S. Treasury bond yield climbed to 3.52 percent, while the two-year counterpart continued a similar march upward. The spread difference between the ten- and two-year bond yields stayed in negative territory, indicating the market’s economic uncertainties about the near future.
The Federal Home Loan Mortgage Corporation’s 30-year fixed-rate elevated to a ten-year high at 6.11 percent. The last time the rate reached 6 percent was in 2008. For more information on the effect of mortgage interest rates on purchase affordability, see “How Higher Interest Rates Affect Homebuying.”
The Texas Repeat Sales Home Price Index, which accounts for compositional price effects, corroborated the trend of depreciation, dipping slightly MOM. This marks the index’s third monthly decline in a row. Compared with last year, the appreciation rate slowed to 11.1 percent YOY in September. The previous high was in March at 21 percent YOY growth. Dallas-Fort Worth and San Antonio were the only metros with a YOY rate above the state average, with Austin falling even further into single-digit territory and staying as the slowest-appreciating metro.
The Texas Housing Affordability Index (THAI) reflects the relationship between the median family income and the median-priced home. A higher THAI indicates relatively greater affordability. Measured by the THAI metric for first-time homebuyers, Houston was the most affordable of Texas’ major metros, followed by Dallas, San Antonio, Fort Worth, and Austin, respectively. While Austin remained the most unaffordable metro in the state, it was the only metro with improved affordability in 3Q2022 amid falling prices.
Household Pulse Survey
According to the U.S. Census Bureau’s Household Pulse Survey, despite rapidly rising mortgage rates, the share of Texas homeowners behind on their mortgage payments stayed at 4 percent as in August (Table 3). This implies that while the overall housing market outlook dimmed, homeowners’ financial health remained healthy. Houston owners especially bolstered their housing status as the owned free/clear homes ratio rose 3 percentage points beyond the state average. Additionally, when asked about future payments, fewer Texas homeowners reported the possibility of foreclosure, as the proportion of delinquent individuals at risk of foreclosure plummeted from 20 to 8 percent (Table 4).


_________________
* All measurements are calculated using seasonally adjusted data, and percentage changes are calculated month over month, unless stated otherwise.

Source: Joshua Roberson, Weiling Yan, and John Shaunfield (November 7, 2022) https://www.recenter.tamu.edu/articles/technical-report/Texas-Housing-Insight