Texas Housing Insight – February 2022 Summary
Texas’ housing market fell slightly in February as supply constraints continued pushing downward on the market, and mortgage rates increased. February sales and active listings were both down, resulting in an inventory level of about one month. Housing starts rose despite the continued surge in building material prices and dip in permits. The greatest challenge remains for homes in the lower price cohorts, as supply still has not caught up to the unprecedented demand. The state’s diverse and expanding economy, favorable business policies, and steady population growth, however, support a favorable outlook.
Supply1
The Texas Residential Construction Cycle (Coincident) Index, which measures current construction activity, increased both nationally and within Texas as employment exceeded the pre-pandemic level, and construction values accelerated. The Texas Residential Construction Leading Index (RCLI) advanced, signaling an expected elevation in future activity. The most influential metric in the leading index was the rise in residential construction value among new construction starts.
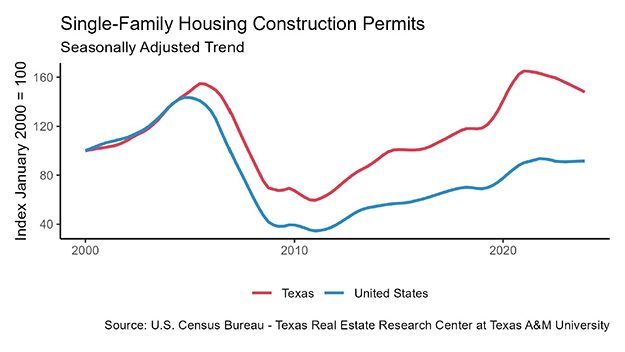
Single-family construction permits contracted half a percent seasonally adjusted for February, lagging the national increase of 3.9 percent month over month (MOM). Austin and Dallas-Fort Worth permit activity fell 10.7 and 0.3 percent, respectively. Houston and San Antonio, on the other hand, increased 9.1 and 2.4 percent, respectively. Houston’s permit growth rate topped the national list, issuing 5,316 permits, while Dallas followed with 4,091.
Lumber prices rose 11.4 percent in a month and were up 78.3 percent year over year (YOY), drastically raising the costs associated with home building. Despite the lumber market disruption, robust economic conditions and copious demand pushed total Texas housing starts up for the fourth consecutive month, soaring 11.3 percent MOM. However, single-family private construction values subsided 0.7 percent MOM. Austin accounted for the majority of the loss with a 23.4 percent dip from the previous month, while San Antonio had a 0.1 percent decrease. Dallas-Fort Worth was unchanged, and Houston posted an 8.3 percent hike.
Texas’ months of inventory (MOI) remained one-month in February while the U.S. had 2.5 months of inventory for the same period, accentuating how intense housing demand is in Texas. Supply continued to be an issue across all price categories but especially for homes in the lowest price range. Total housing inventory is still tight in Texas’ four biggest metros. Both Austin and DFW remained below one month while Houston and San Antonio were slightly above.
Demand
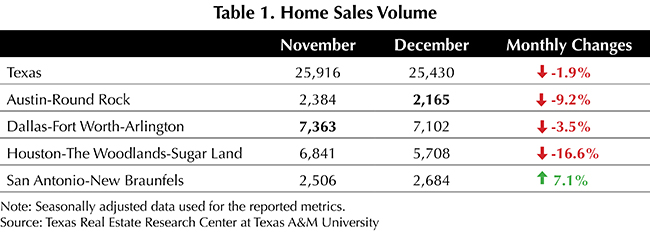
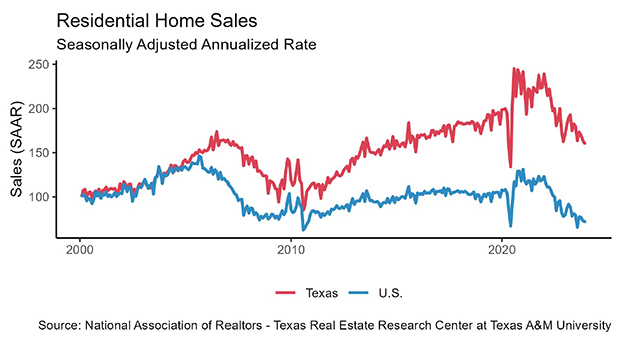
Texas home sales were down from January, ending February slightly above 28,000. Sales fell in each of the four major Texas metros except San Antonio, where sales grew by almost 1 percent. February sales were negatively impacted by rising mortgage rates and higher home prices that continue to shut out some potential homebuyers.
The Federal Reserve is expected to reduce its balance sheet assets and increase the Federal Funds rate at least two to four times in 2022. The ten-year U.S. Treasury bond yield rose to 1.8 percent2, up 0.3 percent from the previous month. The Federal Home Loan Mortgage Corporation’s 30-year fixed-rate hovered around 3.5 percent, rising 0.4 percent over the previous month. The median mortgage rate for the typical Texas homebuyer climbed to 3.5 percent for government sponsored enterprise (GSE) loans in January3 and to 3.2 percent for non-GSE loans. February home-purchase applications inched up by 3.1 percent year to date (YTD), while refinance activities declined by 23.4 percent. (For more information, see Finding a Representative Interest Rate for the Typical Texas Mortgagee).
In January, the median loan-to-value (LTV) constituting the “typical” Texas conventional-loan mortgage dropped from 87.7 a year ago to 83.8. The debt-to-income ratio (DTI) stayed unchanged from a year ago at 36.4 YOY, while the median credit score increased 8.7 points to 752.8 over the same period. The LTV for GSE borrowers stayed constant from December through January at 85.5; meanwhile, their DTI increased slightly from 36.8 to 37.3.
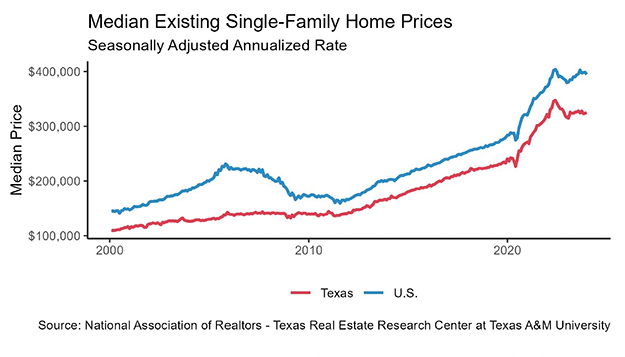
Prices
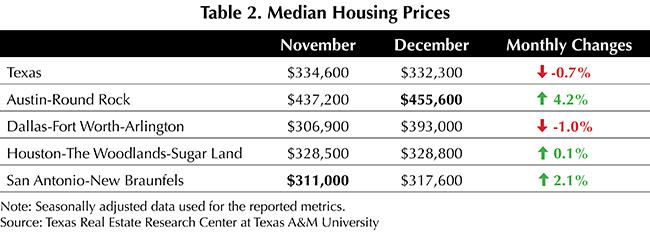
Texas’ median home price continued to increase, consistently growing since the start of the pandemic. Austin remains at the top with half the homes selling for almost $500,000. DFW is a distant second with a median home price around $375,000. Median prices for both Houston and San Antonio hovered slightly above $300,000.
The Texas Repeat Sales Home Price Index accounts for compositional price effects and provides a better measure of changes in single-family home values. The Texas index has risen 31.7 percent since the pandemic started. Texas home prices were up 1.24 percent MOM, escalating for the 21st consecutive month. While growth in all other metros accelerated at a steady pace, Austin’s explosive growth has slowed since last summer. In summary, Texas’ overall increasing home prices decreased its affordability advantage over states like California.
At the metropolitan level, Austin’s repeat sales home price index value surpassed all other metros with 29.1 percent YOY growth. Corroborating with the growth rate of median prices, Dallas followed with a 28 percent YOY expansion. Fort Worth and San Antonio’s indexes rose 23.3 and 19.7 percent, respectively. Houston followed with a 16.9 percent gain.
Household Pulse Survey
According to the U.S. Census Bureau’s Household Pulse Survey, the share of homeowners unable to make next month’s mortgage payment increased on a state level. Over 8.6 percent were “not at all confident” or only “slightly confident” they’d be able to make payments. The national average was just over 7.1 percent (Table 1). The number of Texas mortgage owners facing foreclosure increased (Table 2). However, the share of respondents who reported themselves as “not likely at all” to lose their house due to foreclosure also increased, inching up 1 percent to 43 percent. This is marginally above the national average of 42.9 percent (Table 2).
________________
1 All measurements are calculated using seasonally adjusted data, and percentage changes are calculated month over month, unless stated otherwise.
2 Bond and mortgage interest rates are nonseasonally adjusted. Loan-to-value ratios, debt-to-income ratios, and the credit score component are also nonseasonally adjusted.
3 The release of Texas mortgage rate data typically lags the Texas Housing Insight by one month.

Source: Joshua Roberson, Weiling Yan, and John Shaunfield (May 31, 2022) https://www.recenter.tamu.edu/articles/technical-report/Texas-Housing-Insight